Market Trends: Second Quarter of 2019
Cindy Paur August 6, 2019
Cindy Paur August 6, 2019
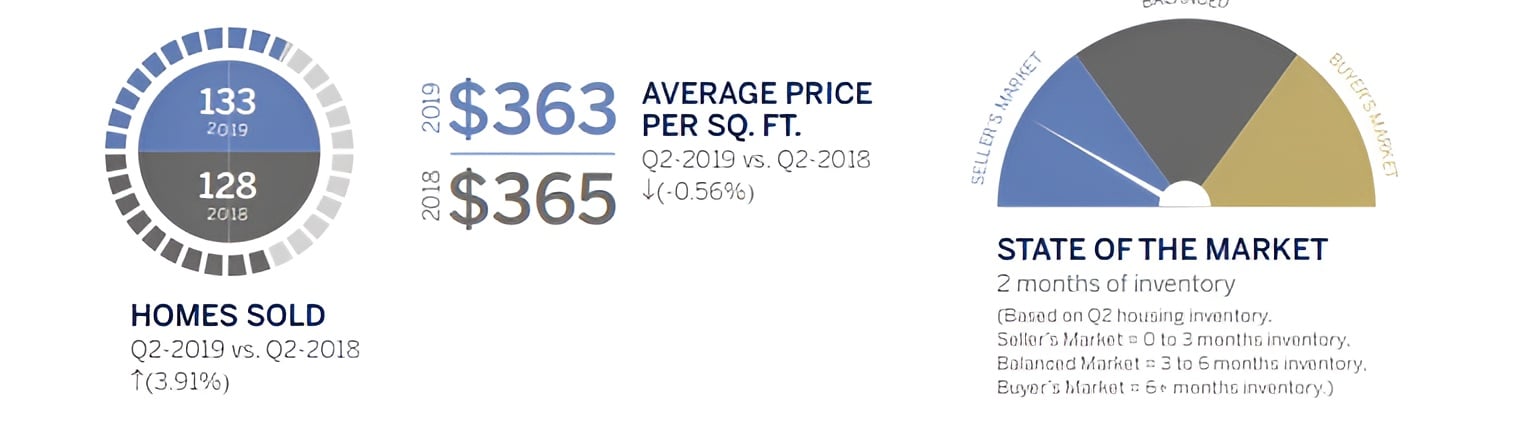
Statistics from the second quarter of 2019 are in, and Realogics Sotheby’s International Realty has analyzed the data with a look at the housing market trends for the second quarter of 2019, from the shores of Bainbridge Island’s waterfront homes and in-city living opportunities to the Eastside’s most distinguished residences.
Read the Seattle Single-Family Homes Report
Read the Seattle Condominiums Report
Read the Eastside Single-Family Homes Report
Read the Bainbridge Island Single-Family Homes Report
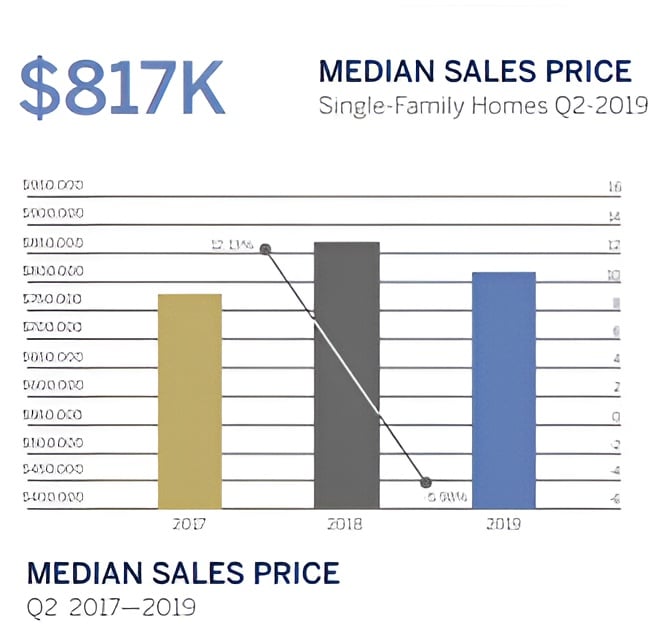
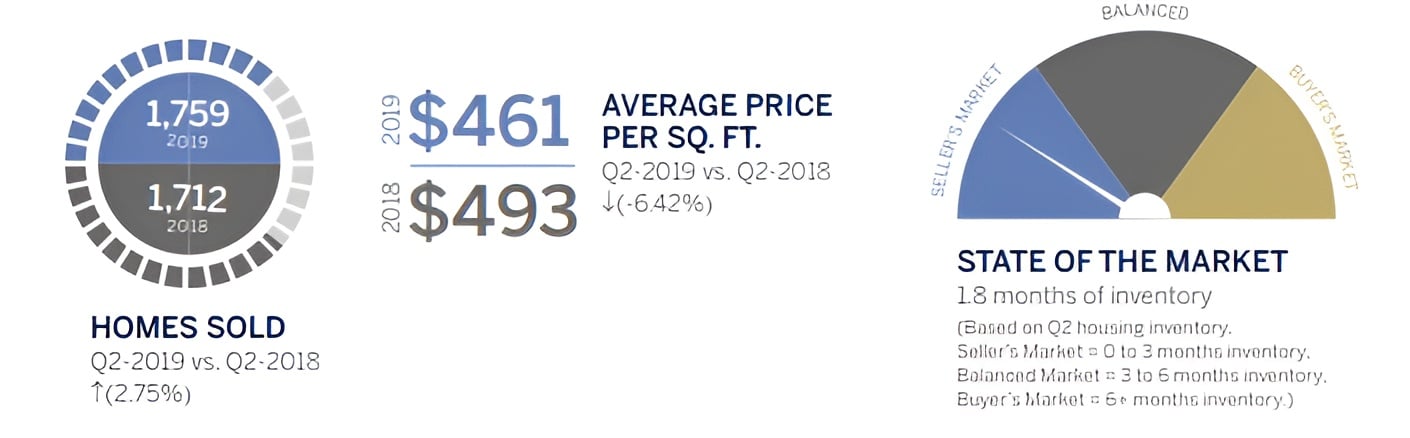
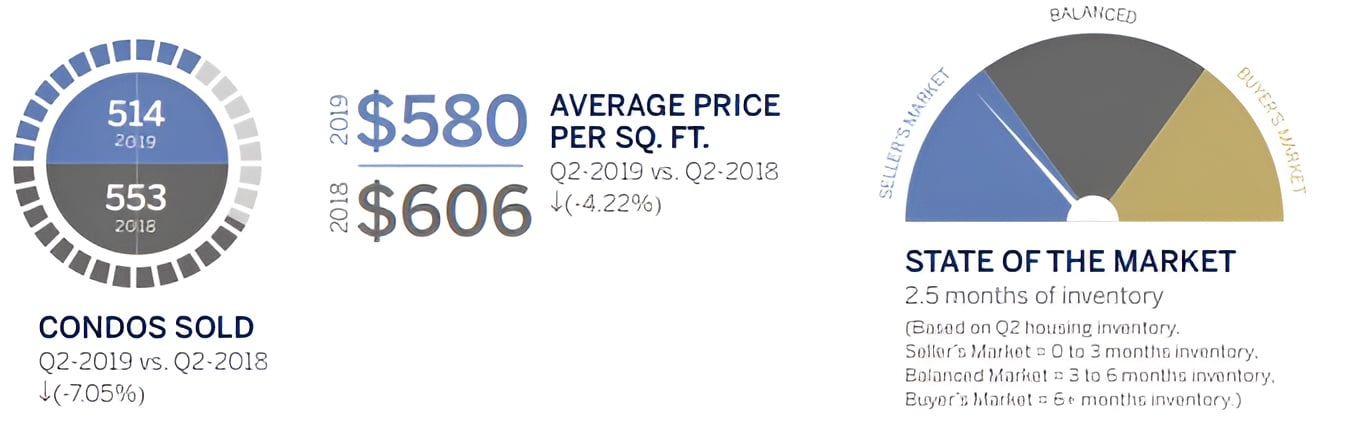
With 1.8 months of inventory in the second quarter of 2019, Seattle was once again a seller’s market. Homes sold with more speed than in Q1-2019, selling in an average of just 25 days.
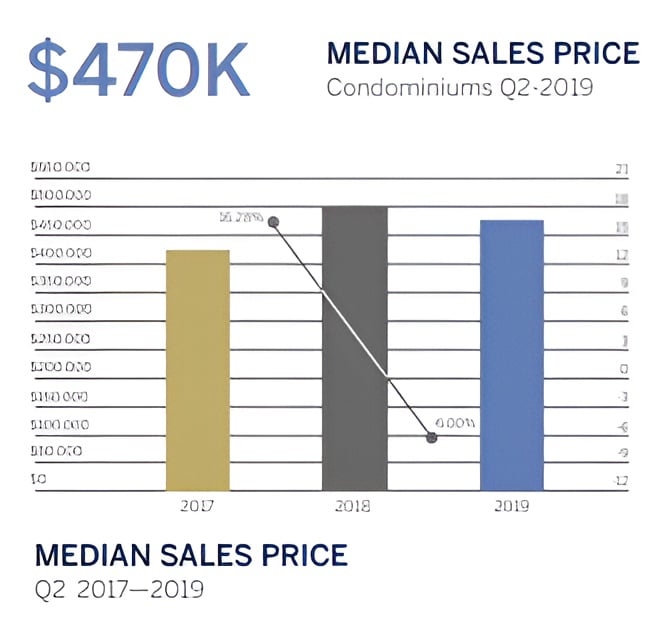
Higher levels of condominium inventory continued in the Seattle condominium market, but didn’t impact market times, which fell to 36 days, down from over 2 months in Q1-2019.
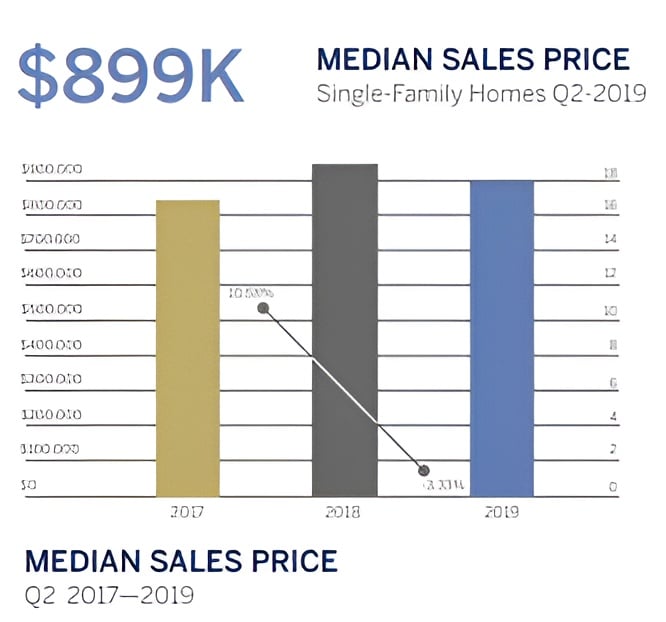
Median home prices on the Eastside remained relatively steady in Q2-2019 at $899,000. Buyers benefited from more options than in recent years, with a 30 percent surge in inventory
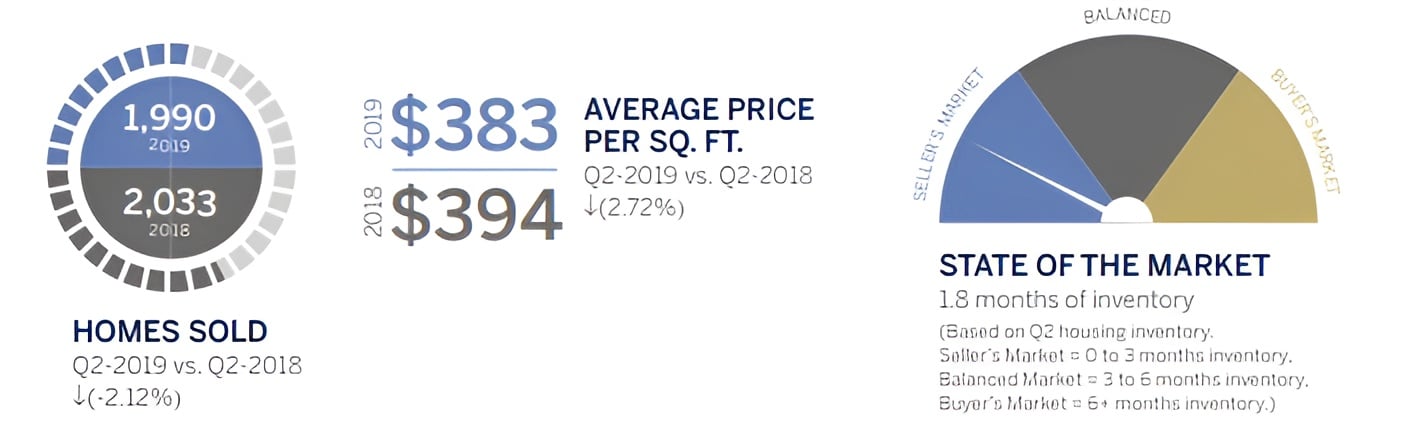
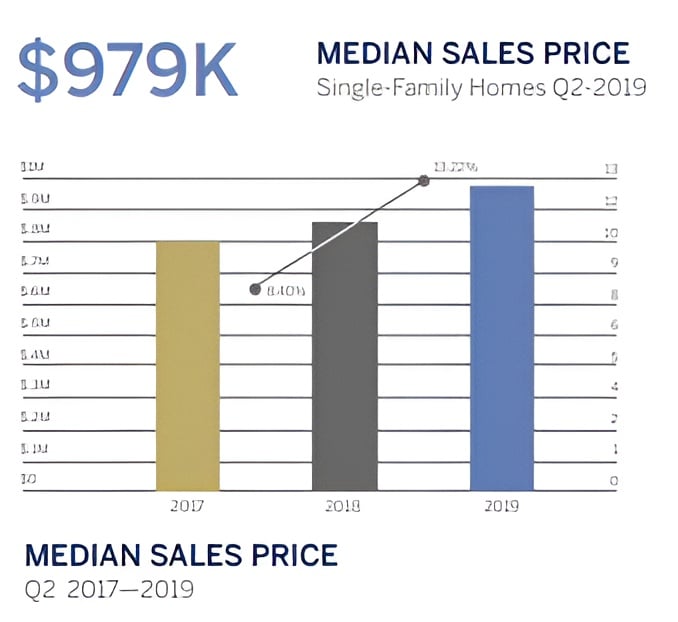
Home values saw year-over-year double-digit growth in the second quarter of the year, increasing from $865,000 in Q2-2018 to $979,000 in Q2-2019, a 13.2% gain.

Explore the top Eastside and Seattle schools, from elite districts to leading universities.

Explore Sotheby’s International Realty’s exclusive media partnerships across global luxury brands.

Realogics Sotheby’s International Realty sets the standard for luxury and innovation.
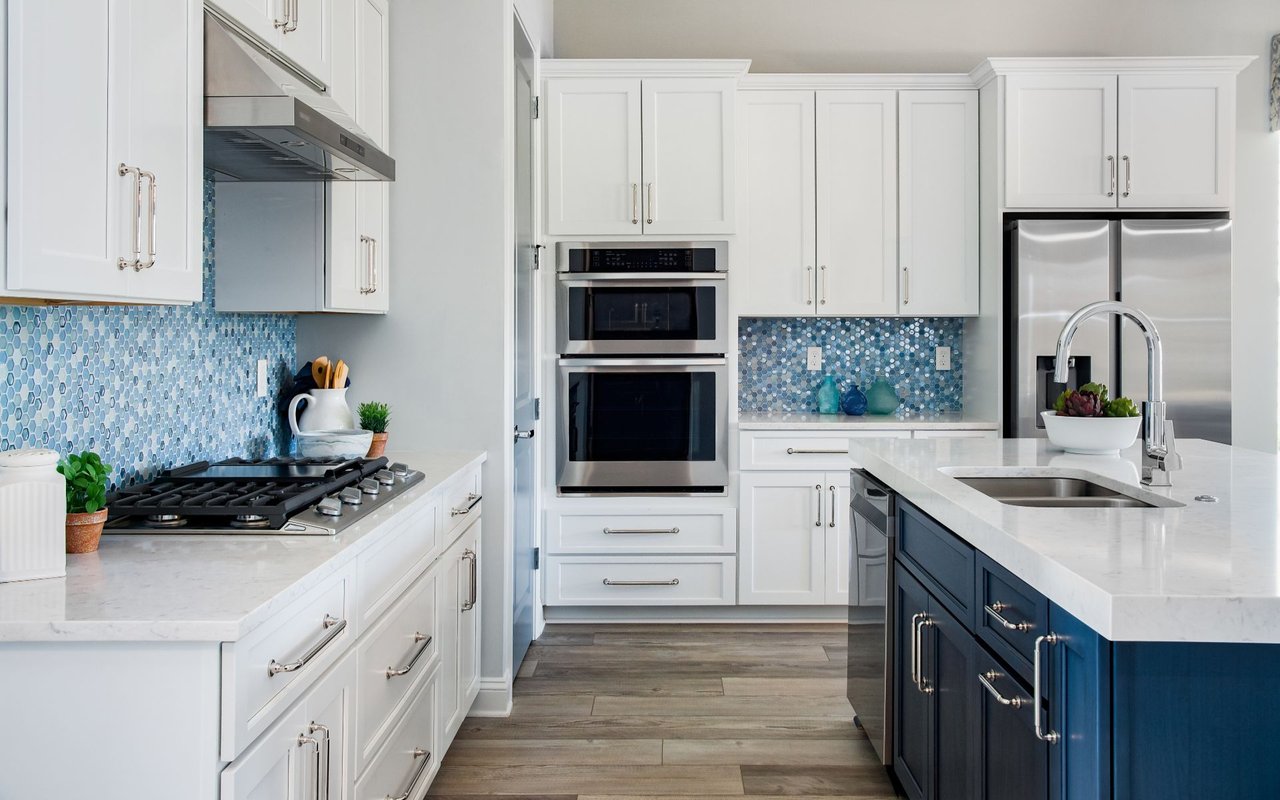
Discover the allure of Pacific Northwest waterfront living and explore real estate market insights

Please contact me if you're interested in receiving your own paper copy.

Building community connections through golf, philanthropy, and real estate leadership events
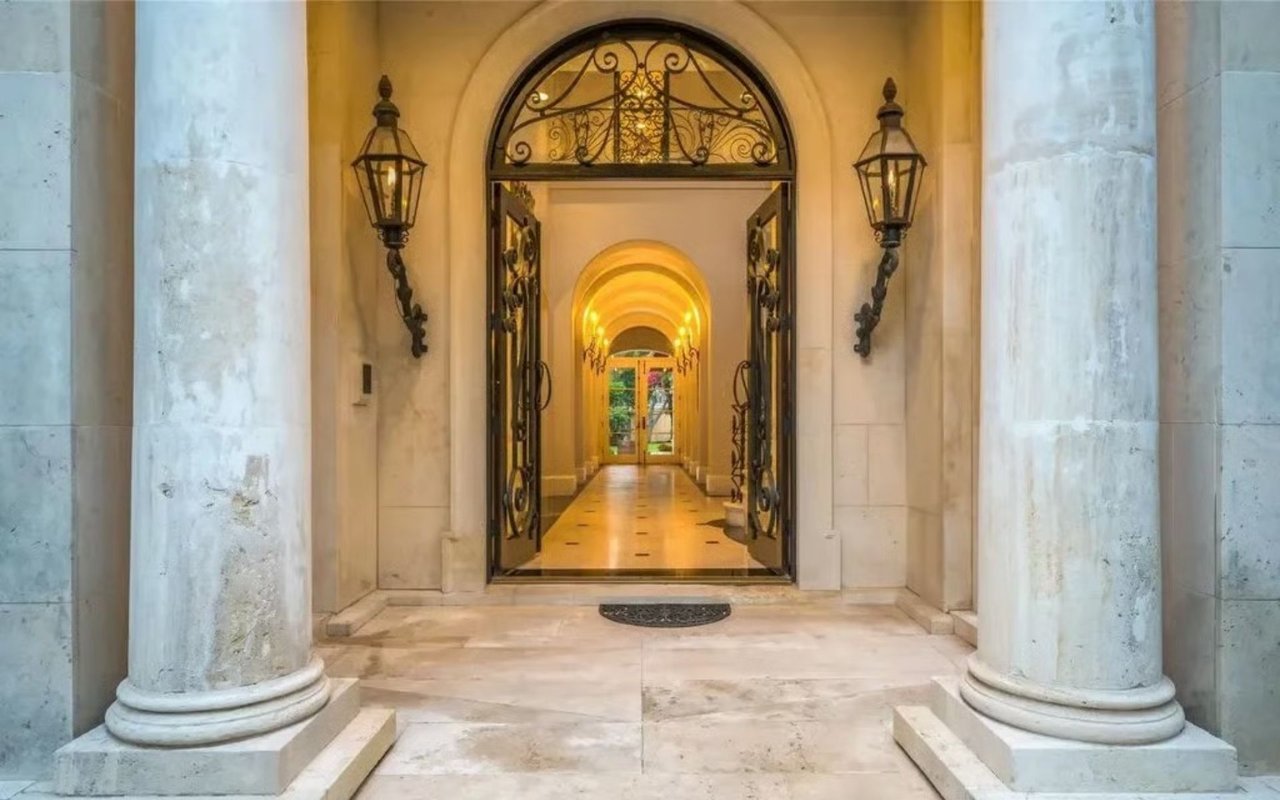
Elegant homes from coast to coast with grand foyers that define luxury and architectural charm.
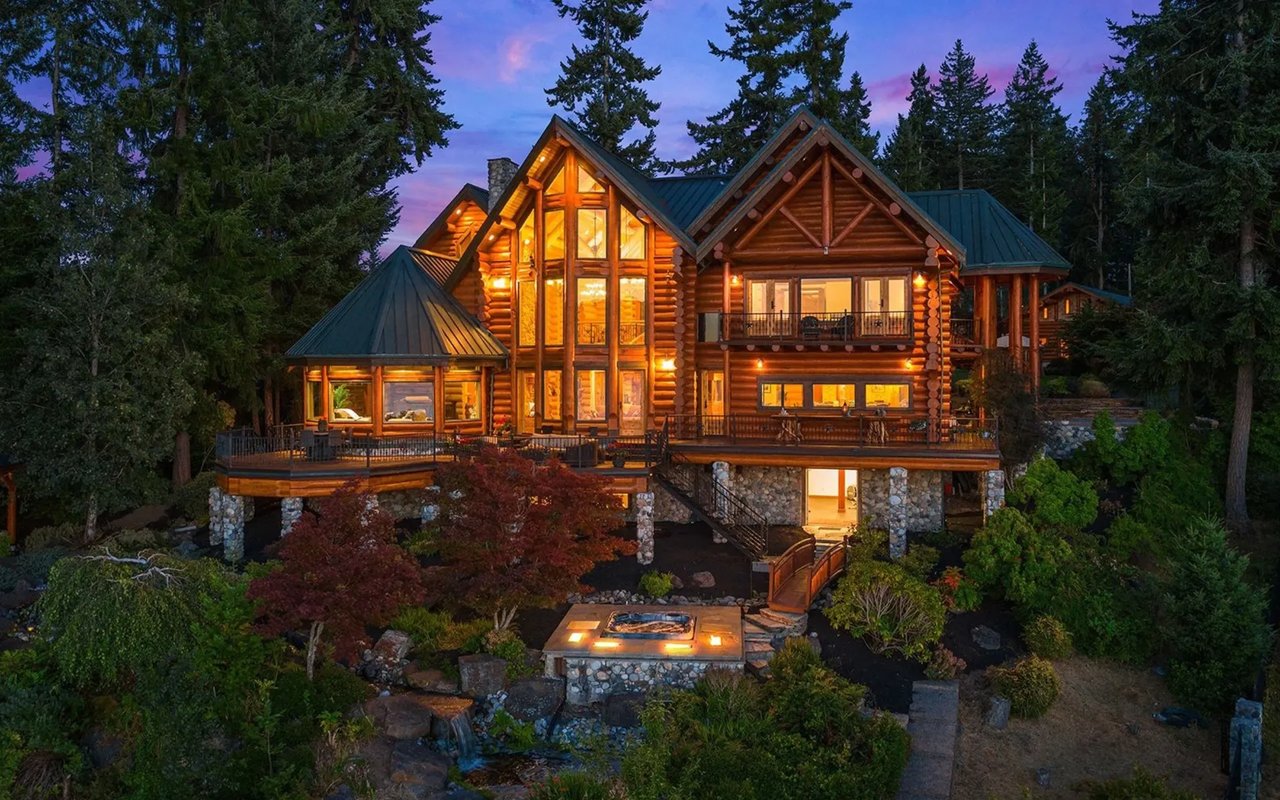
Quarterly insights into Puget Sound’s housing markets across key counties and communities in Q3-2023.
Discover the most exclusive global residency programs designed for luxury property investors.
Get assistance in determining current property value, crafting a competitive offer, writing and negotiating a contract, and much more. Contact me today so I can guide you through the buying and selling process.